
As you folks know, I’ve been struggling with collecting all the stats from all the grids every month, and, earlier this year, have almost fully automated the process, using an extremely jury-rigged Filemaker script.
Today, I accidentally stumbled on the fact that Google Spread can be used to do the same thing, without the heavy database workload.
The key is two Google functions — ImportHTML and ImportXML. The former works well if the data is in a table or a list, and you can use the Index function to pull out the table or list element you want. The latter looks for particular “class” tags in the CSS.
Take, for example, the stats page for 3rd Rock Grid, which uses a table.
The following function pulls out the total number of regions, where A1 is where the URL for the stats page is stored:
=index(importhtml(A1,"table",1),3,2)
The stats page for Eureka World doesn’t have a table, so I used the HTML inspector as in this tutorial to get the XPath for the region data.
=index(importxml(A2,"//span[@class='nowrap']"),2)
I’ve created a public Google Sheet with the current stats pages of the active grids. I don’t have time to go through and figure out the syntax for each grid. Since each grid displays its data in slightly different ways, you’d need a different formula for each one.
I went through and did about 20, out of some 155. As you can see in the image below, Genesis Global Journey puts asterisks around their numbers, so I’d have to add some more formula in there to clean that up. And Eureka World’s formula pulls in “Regions: 53″ so I’ll have to do some clean-up on those, as well.
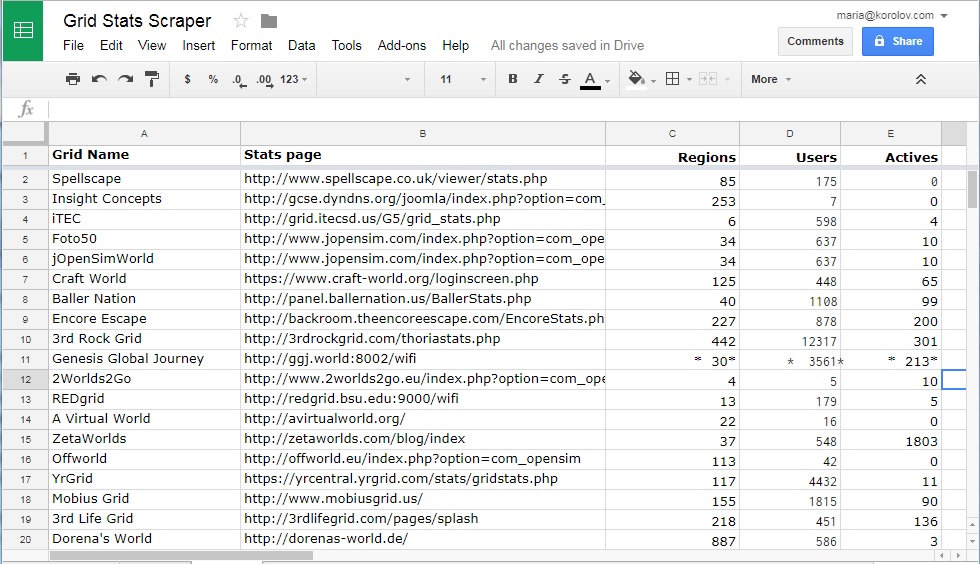
A grid stats scraper built in Google Sheets. (Image by Maria Korolov.)
Does anyone want to help out with this? If so, everyone could have a copy of this for their own use, if they want one, and it would make it a lot easier for me to collect the data once a month.
I might even be able to collect the data more often, and pull the statistics automatically into a table that I could then embed in articles, instead of manually having to export the data from my database each month and format it for the web.
One thing I’ve noticed is that Google Sheets sometimes shows the correct looked up value, and other times doesn’t, giving an “#REF!” error message instead for the same formula. Apparently, there is a limit of how many lookups a spreadsheet can do, and I’ve been running it ragged today playing around with the formulas.
Does anyone have any advice on getting this to work better? Thanks!
P.S. If you’re going to play around with the sheet, please make your own working copy first so you have room to work in.

Source: Hypergrid Business